|
The system allows the Teacher to track different aspects of course statistics in the Tracking section .
To check statistics of the course, enter the necessary course and click the Tracking icon ( ) in the left course menu. The system will display an overview report for all aspects: ) in the left course menu. The system will display an overview report for all aspects:
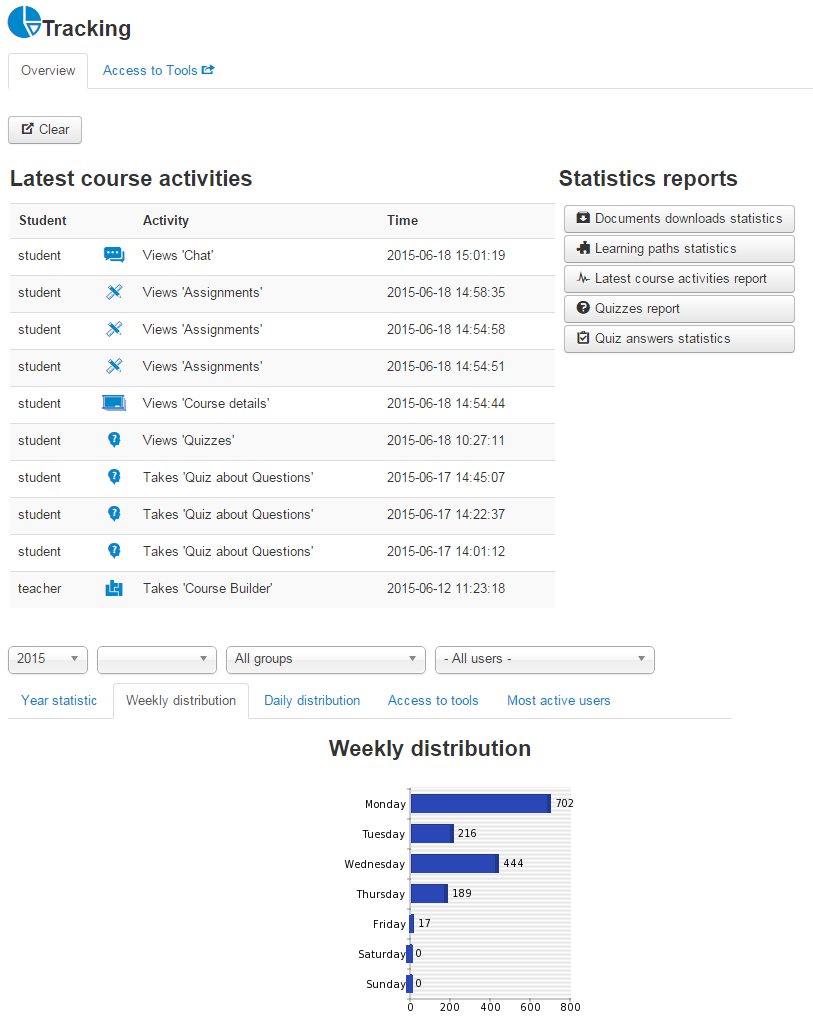
Fig. ‘Tracking’
Under the Latest course activities the latest actions of the course students are shown and the time when the action was taken.
Under the Statistics reports link to different kinds of reports are provided. It is possible to view the following reports here:
| 1. | Documents downloads statistics. This report shows which files in the Documents section were downloaded by which users/groups, how often and when the last download took place. |
| 2. | Learning paths statistics. This report shows the list of all Learning Paths and SCORMs of the course. By clicking on the 'magnifying glass' icon all the statistics provided by a certain Learning Path or SCORM is shown for a certain user/group. |
If you filter the list by user and by Learning Path you can mark certain steps of the Learning Path completed/incomplete manually for this user.
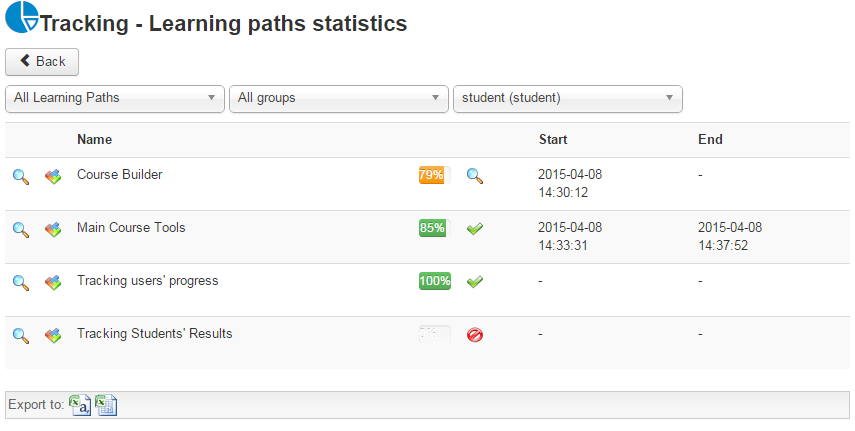
Fig. 'Changing step status'
| 3. | Latest course activities report. This report allows to view latest course activities filtered by certain user/group. |
| 4. | Quizzes report. This link forwards you to the Reports section in the Quizzes section. |
| 5. | Quiz answers statistics. This link forwards you to the page where it is possible to view all the users answers to all the questions of all the quizzes. The answers statistics can be filtered by a quiz, a question or a group of users. |
Under the Access to tools it is possible to view attendance statistics: you can check how often each of your course Students attends various sections of the system (Assignmnets, Docs, Links, Quizzes, etc.). In addition you can view a detailed statistics report for each course section.
The group of drop-down lists above the report table makes it possible to set filtering criteria for the statistics report: you can select for which user, year or month the report should be generated.
| • | At the top of the report you can see a table with a statistics breakdown by months. |
| • | Click a month name in the left table column to display a detailed statistics report for the selected month. The report will show data for each day of the month. |
Click a section name link the table head to show detailed statistics report of attendance for the selected section.
Below the table the system will display five graphs:
| 1. | Year (month) statistics: shows how many times course web pages were opened (downloaded) within a certain month. |
| 2. | Daily distribution: shows how many times course web pages were opened (downloaded) during the day (on this graph an hourly breakdown is given). |
| 3. | Weekly distribution: shows how many times course web pages were opened (downloaded) during the week (on this graph a daily breakdown is given). |
| 4. | Access to tools: shows how many times web pages in various sections were opened (downloaded). |
| 5. | Most active users: shows most active users. |
Use the Clear ( ) button in the top left corner to clear report statistics. ) button in the top left corner to clear report statistics.
If you have any questions or suggestions regarding our help documentation, please post them to our ticket system.
|